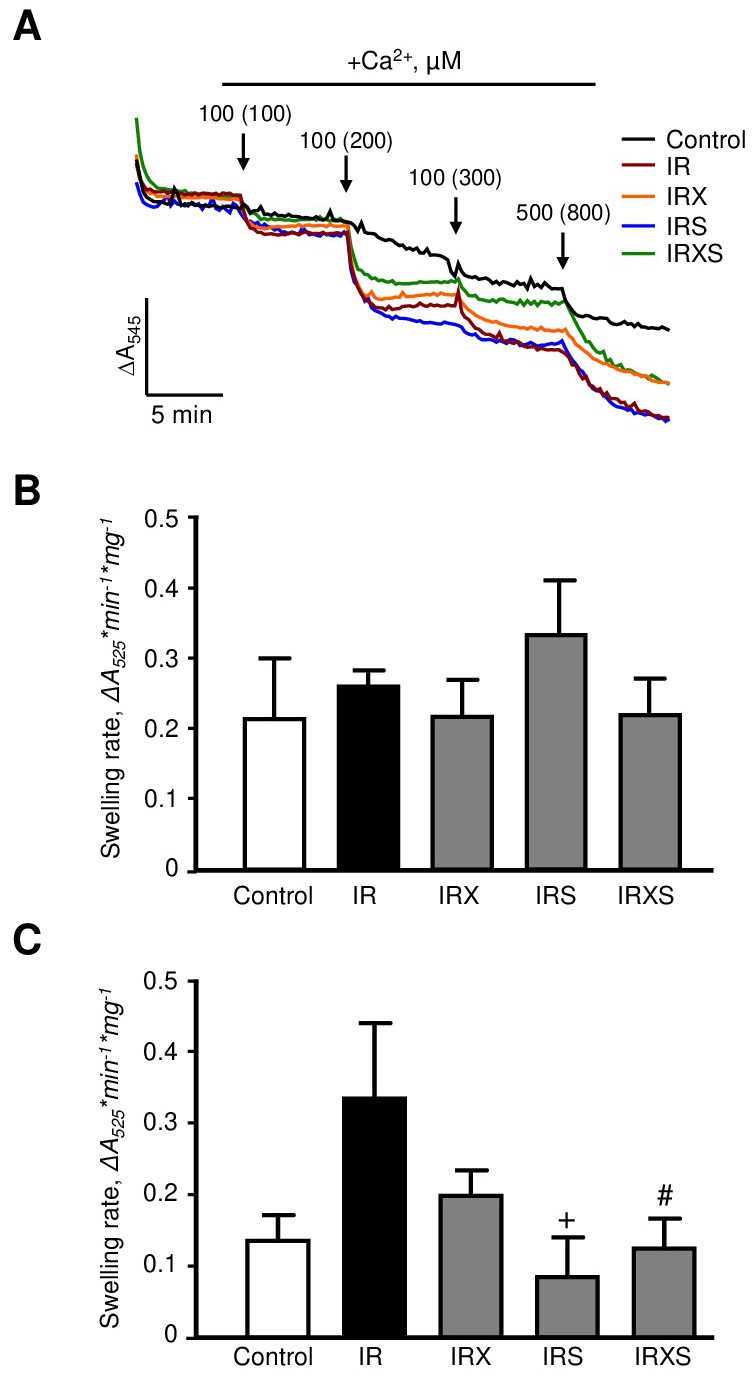
Fig. 4. Mitochondrial Ca2+- induced swelling. Representative curves (A) and quantitative data (B, C) of mitochondrial swelling measured by monitoring the decrease in light scattering at 525 nm. To induce swelling of mitochondria, Ca2+ (arrows on the top, A) was added to achieve a final concentration of 100, 200, 300, and 800 µM in the swelling buffer. Mitochondrial swelling rates at 200 µM (B) and 300 µM (C) are expressed as ΔAbs per min in 1 mg of protein. Groups: Con, control (black line); IR, ischemia-reperfusion (red line); IRX, IR+XJB (orange line); IRS, IR+SfA (blue line); IRXS, IR+XJB+SfA (green line). +P<0.05 IRS vs.IR; #P<0.05 IRXS vs. IR. n=6 per each group.